👾
Mr Robot
LinkedinFacebookYoutubeMediumGithub
  • Welcome
  • SOC
    • Effective Threat Investigation For SOC Analysts Book
      • Chapter 1 : Investigating Email Threats
  • Malware Analysis
    • Mastering Malware Analysis Book
      • Chapter 4 : Unpacking, Decryption And Deobfuscation Part 1
    • Practical Reverse Engineering Book
  • Threat Intelligence
    • Visual Threat Intelligence Book
Powered by GitBook
On this page
  • Introduction to Packers
  • Identifying a Packed Sample
  • Automated Unpacking Techniques
  • Manual Unpacking Techniques
  • Introduction to Manual Unpacking in Malware Analysis
  • Manual Unpacking Techniques In Our Chapter
  • Dumping the unpacked sample and fixing the import table
  • Fixing the Import Table
  1. Malware Analysis
  2. Mastering Malware Analysis Book

Chapter 4 : Unpacking, Decryption And Deobfuscation Part 1

This chapter focuses on techniques used by malware authors to evade detection and make reverse engineering more difficult. It covers how to identify, unpack, and decrypt malware using various methods.

PreviousMastering Malware Analysis BookNextPractical Reverse Engineering Book

Last updated 3 months ago

Note : All Screenshots In This Blog Is From The Book , So You Can Trace Them If You Read From The Book Align With This Blog.

Introduction to Packers

Packers are software tools designed to compress or encrypt executable files to obfuscate their content and behavior. Malware authors commonly use packers to hinder reverse engineering and analysis.

What is a Packer?

  • A packer compresses and/or encrypts an executable file, making it harder to analyze.

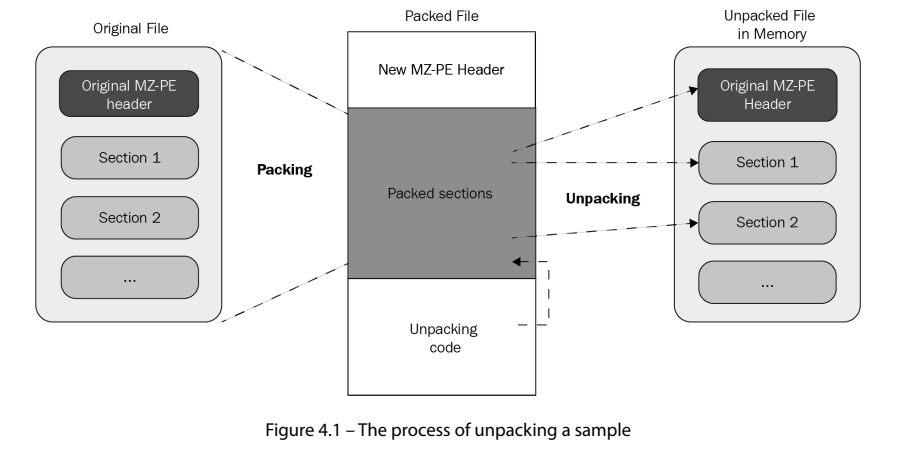
  • It includes a small piece of code (the "stub" or "loader") responsible for unpacking the original code into memory during execution.

  • Packers are used by malware authors to evade detection and make reverse engineering more time-consuming.

Why Use Packers?

  1. Compression: Reduces file size for delivery and storage.

  2. Obfuscation: Hides the actual code and data of the malware, complicating static analysis.

  3. Evading Detection: Alters the file structure to bypass signature-based antivirus detection.

Types of Packers

  1. Legitimate Protectors: Commercial tools designed to protect software from piracy and reverse engineering, often including advanced encryption and anti-debugging mechanisms.

  2. Malicious Encryptors: Tools specifically designed to evade antivirus detection and hide malicious traits. These are rarely available in the open market.

  3. General Packers: A catch-all term referring to tools with both compression and protection capabilities.

Common Packing and Encryption Tools

Multiple tools can pack/encrypt executable files, but each has a different purpose. It’s important to understand the difference between them as their encryption techniques are customized for the purpose they serve

Packers :

  • UPX (Ultimate Packer for Executables) : This is an open source packer, and its command-line tool can unpack the packed file.

  • ASPack : This is a commonly used packer that has a free and a premium version. The same company that provides ASPack also provides protectors such as ASProtect.

  • Themida

Legal protectors :

The main purpose of these tools is to protect programs against reverse engineering attempts – for example, to protect the licensing system of shareware products or to hide implementation details from competitors. They often incorporate encryption and various anti-reverse engineering tricks. Some of them might be misused to protect malware, but this is not their purpose.

Malicious encryptors :

Similar to legal protectors, their purpose is also to make the analysis process harder; however, the focus here is different: to avoid antivirus detection, you need to bypass sandboxes and hide the malicious traits of a file. Their presence indicates that the encrypted file is more than likely to be malicious as they are not available on the legal market.


Identifying a Packed Sample

Identifying if a sample is packed is the first step to analyzing it. Here's how:

Technique 1: Using Static Signatures

  • Tools like PEiD have a database of signatures from known packers, allowing quick identification of many popular packing tools.

  • These signatures are usually a specific byte sequence or a hash value that corresponds to a particular packer.

Technique 2: Evaluating PE Section Names

  • Packed executables often change section names from standard ones (like .text, .data, .rsrc) to non-standard names, such as UPX0, ASPack, or .packed.

  • This renaming makes the file less recognizable to standard static analysis tools.

  • These section names can help you identify whether this file is packed. Searching for these section names on the internet could help you identify the packer that uses these names for its packed data or its stub (unpacking code). You can easily find the section names by opening the file in PEiD and clicking on the > button beside EP Section. By doing this, you will see the list of sections in this PE file, as well as their names.

Technique 3: Using Stub Execution Signs

  • The Entry Point (the starting address of the program) of a packed file is typically not located in the standard .text section. Instead, it often points to a section used for unpacking.

  • The packer's stub code is often located at the end of the last section, where it decrypts and prepares the original executable for execution.

  • Analyzing execution flow with dynamic debuggers can reveal stub-related activities like memory allocations and decryption routines.

  • The first section’s memory permission will be mostly READ | WRITE.

Technique 4: Detecting a Small Import Table

  • A packed sample often has a very small Import Address Table (IAT).

  • This is because most packers load the necessary APIs dynamically after unpacking is complete, instead of relying on the IAT of the PE file.

  • The small number of APIs in the IAT is a strong indicator of a packed executable.

  • Tools like CFF Explorer can be used to analyze the IAT and highlight discrepancies.

The reason for this is that most of the packers load the import table manually after unpacking the PE file, as shown in the following screenshot :

The packed sample removed all the APIs from ADVAPI32.dll and left only one, so the library will be automatically loaded by Windows Loader. After unpacking, the unpacker stub code will load all of these APIs again using the GetProcAddress API.

Additional Indicators of Packed Samples

  1. High Entropy Values: Use tools like DIE or binwalk to calculate entropy. Packed sections exhibit high entropy due to encryption or compression.

  2. Overlay Presence: Some packed files have additional data appended to the end of the PE file, known as overlays. Analyze the file's structure for unusual sections.

  3. Unusual Debug Information: Packed samples often lack proper debug information or contain invalid entries to mislead analysts.

  4. Execution Behavior: During execution, packed files commonly allocate large memory regions for unpacking, followed by sudden spikes in API calls.


Automated Unpacking Techniques

General Concepts

  • Packers compress executable files, which can help malware authors hide malicious code and bypass static signature-based detections.

  • Automated unpacking techniques are faster and easier to use compared to manual unpacking, providing a clean unpacked sample quickly.


Technique 1: Official Unpacking Process

  • Some packers, such as UPX or WinRAR, have self-extracting capabilities that can be used to unpack the packed file.

  • These tools are not designed to hide malicious traits and offer unpacking features for developers and end users.

    • Example: The command-line tool for UPX can be used with the -d flag to unpack files.

Technique 2: OllyScript with OllyDbg

  • OllyDbg scripting automates the unpacking process by scripting actions like setting breakpoints, continuing execution, modifying the EIP register, or altering bytes.

  • It is particularly useful for handling simpler packers and inspired later automated methods.


Technique 3: Generic Unpackers

  • These are debuggers pre-scripted to handle specific packers or automate manual unpacking processes.

    • Tools like QuickUnpack and Unipacker can work with multiple packers.

    • Unipacker, based on the Unicorn engine, supports packers like ASPack, FSG, MEW, and MPRESS.

  • Ensure these tools are used in an isolated environment as malware may escape.


Technique 4: Emulation

  • Emulation tools simulate the execution of packed files to trigger the unpacking routine.

  • Tools like Unipacker can run samples in an emulated environment and extract the unpacked payload.

  • they can help set up more sophisticated breakpoints and can also be easily scripted (such as libemu and the Pokas x86 Emulator), as shown in the following code:

from pySRDF import *
emu = Emulator(“upx.exe”)
x = emu.SetBp(“isdirty(eip)”) # which set bp on Execute on modified data
emu.Run() # OR emu.Run(“ins.log”) to log all running instructions
emu.Dump(“upx_unpacked.exe”, DUMP_FIXIMPORTTABLE) # DUMP_ FIXIMPORTTABLE create new import table for new API
print(“File Unpacked Successfully\n\nThe Disassembled Code\n---------------”)
  • Another great example of such a tool based on emulation is unipacker. It is based on the Unicorn engine and supports a decent amount of popular legitimate packers, including ASPack, FSG, MEW, MPRESS, and others.


Technique 5: Memory Dumps

  • This involves executing the malware and capturing a memory snapshot of its process.

    • Sandboxing tools, like Cuckoo Sandbox, offer memory dumps as a core feature.

    • The memory dump provides unpacked content for static analysis but usually requires additional work.

      • Import tables often need to be rebuilt before further analysis or execution.

Limitations of Automated Unpacking

  1. Incomplete Coverage: Automated tools cannot handle all packers, encryptors, or protectors, especially those with custom or advanced features.

  2. Anti-VM or Anti-Debugging: Many packers include techniques to detect and counter analysis environments.

  3. API/Assembly Challenges: Some packers use non-standard APIs or unusual instructions that confuse emulators.

  4. Partial Results: Even after automated unpacking, some samples may require manual intervention for full analysis.

Additional Notes

  • Packed samples may:

    1. Compress PE sections and add a new section for the unpacking stub.

    2. Start execution from a decryption process in the last section.

    3. Remove APIs from standard libraries (like ADVAPI32.dll) and dynamically reload them.

    4. Change section names to unusual identifiers like UPX0 or .aspack.

  • Restore original values for unpacking if using a standard tool.


Manual Unpacking Techniques

Introduction to Manual Unpacking in Malware Analysis

Why Manual Unpacking?

  • Many modern malware samples utilize custom packers, making automated unpacking ineffective.

  • Some packers include anti-debugging, anti-virtualization, and code obfuscation techniques that require step-by-step analysis.

  • Manual unpacking provides complete control, ensuring that the analyst retrieves a clean, functional sample for further analysis.

Key Concepts from the Book

  • Understanding the Portable Executable (PE) format is crucial before attempting manual unpacking.

  • Memory allocation and execution flow must be carefully traced to identify unpacking routines.

  • The book emphasizes the importance of reconstructing the Import Address Table (IAT) after dumping an unpacked binary.


Tools Recommended in Mastering Malware Analysis

  • OllyDbg/x64dbg - For debugging packed binaries.

  • IDA Pro - For static analysis of packed malware.

  • Scylla or Import REConstructor - For fixing the Import Address Table (IAT).

  • Process Hacker - To monitor memory usage and injection techniques.

  • PE-bear & CFF Explorer - For analyzing and modifying PE structures.

  • LordPE - For dumping memory regions of unpacked binaries.


Manual Unpacking Techniques In Our Chapter

Technique 1 – Memory Breakpoint on Execution

Overview

Memory breakpoints on execution are a fundamental technique for manually unpacking packed malware. This method involves setting breakpoints on memory allocation functions to capture the moment when the packed code is decompressed or decrypted into memory. By intercepting execution at these points, analysts can extract the original malware code before it runs.

Understanding Memory Breakpoints

Why Use Memory Breakpoints?

  • Many packers allocate memory dynamically for unpacking and execution.

  • Intercepting execution at memory allocation APIs allows analysts to locate the unpacked payload before it is executed.

  • Identifies unpacking stubs that decrypt or decompress packed code into a writable memory section.

Key Windows APIs to Monitor

  1. VirtualAlloc - Allocates memory for execution.

  2. WriteProcessMemory - Writes unpacked data into allocated memory.

  3. NtProtectVirtualMemory - Modifies memory protection, often used when unpacking encrypted code.

  4. HeapAlloc - Used by some packers for dynamic memory allocation.

Step-by-Step Implementation

1. Load the Packed Sample into a Debugger

  • Use OllyDbg or x64dbg to load the packed executable.

  • Disable ASLR (Address Space Layout Randomization) if necessary to stabilize memory addresses.

2. Set Breakpoints on Memory Allocation APIs

  • Navigate to the debugger's breakpoints tab and set breakpoints on:

    • VirtualAlloc

    • WriteProcessMemory

    • NtProtectVirtualMemory

    • HeapAlloc

  • These breakpoints will pause execution whenever the malware requests new memory allocations.

3. Execute and Observe Memory Allocation Calls

  • Run the sample until it reaches a breakpoint.

  • Check the stack and register values to locate where unpacked code is written.

  • If the malware calls VirtualAlloc followed by WriteProcessMemory, this indicates an unpacking routine.

4. Locate and Extract the Unpacked Payload

  • Identify the memory region where unpacked code is stored.

  • Dump this memory using LordPE or Scylla "Will Discuss Later"

  • Analyze the dumped file to check for valid PE headers and executable sections.

5. Rebuild the Unpacked Executable

  • If necessary, reconstruct the Import Address Table (IAT) using Import REConstructor.

  • Fix section alignments and headers with PE-bear or CFF Explorer.

  • Save the final unpacked executable for further analysis.

Common Challenges and Solutions

1. The Sample Does Not Hit the Breakpoint

  • Some packers use indirect execution or obfuscation techniques.

  • Try setting breakpoints on lower-level functions like NtAllocateVirtualMemory.

  • Use execution tracing to identify alternative unpacking functions.

2. The Dumped File Is Corrupt

  • Ensure that you have dumped the correct memory region.

  • Verify PE headers and section alignments.

  • Rebuild the IAT to restore proper execution.

3. Anti-Debugging Techniques Prevent Analysis

  • Use anti-anti-debugging plugins in x64dbg.

  • Patch API return values to bypass debugger checks.

Key Takeaways

  1. Memory breakpoints allow analysts to capture unpacked code before execution.

  2. Identifying the correct memory region is crucial for obtaining a clean sample.

  3. Rebuilding the unpacked binary requires fixing imports and PE headers.

  4. Advanced malware may require bypassing anti-debugging techniques.


Technique 2 – Call Stack Backtracing

Overview

Call stack backtracing is a powerful technique for manually unpacking malware that executes its payload by returning from a function call. By analyzing the call stack, analysts can trace the execution flow and locate the Original Entry Point (OEP) of the unpacked binary. This technique is particularly useful for malware that uses return-oriented execution to transition from the unpacking stub to the actual malicious payload.

Concept: Many packers execute the unpacked code by returning from a function call. Backtracing the call stack helps locate the original entry point (OEP)

Understanding Call Stack Backtracing

Key Indicators of Return-Oriented Execution

  • The unpacker modifies return addresses to redirect execution flow.

  • Calls to RET or POPAD instructions followed by a jump to a new memory location.

  • Sudden changes in execution flow without clear function calls.

Why Use Call Stack Backtracing?

  • Many packers execute the unpacked payload by returning from a function call.

  • Identifying the transition point between the unpacking stub and the original code is essential for retrieving the clean executable.

  • By analyzing the call stack, analysts can determine where execution control is passed to the unpacked code.

This Example Will Make Stack Backtracking More Clear :

func01:
1: push ebp
2: mov ebp, esp ; now ebp = esp
...
3: call func02
...
func02:
4: push ebp
; which was the previous esp before the call ; now ebp = new esp
5: mov ebp, esp 
...
6: call func03
...
func03:
7: push ebp
; which is equal to previous esp ; ebp = another new esp
8: mov ebp, esp 
...

Step-by-Step Implementation

1. Load the Packed Sample into a Debugger

  • Use OllyDbg or x64dbg to analyze the packed binary.

  • Disable ASLR if needed to stabilize execution addresses.

2. Set a Breakpoint on Common Transition Points

  • Identify areas where the packer may pass execution to the real payload.

  • Set breakpoints on RET, POPAD, and JMP ESP instructions, which are commonly used to transition to the unpacked code.

3. Execute the Sample and Analyze the Call Stack

  • Step through execution until a breakpoint is triggered.

  • Open the call stack window in the debugger and examine return addresses.

  • Look for a return address that points outside the current function or module.

  • Continue with point until we reach to the OEP or last return value

4. Identify the Original Entry Point (OEP)

  • Once the return instruction transfers execution to a new memory region, analyze the destination address.

  • Set a new breakpoint at this location and continue execution.

  • If execution stabilizes, you have likely reached the OEP.

5. Dump the Unpacked Executable

  • Once the OEP is identified, dump the process memory using LordPE or Scylla.

  • Verify the dumped file’s integrity by checking the PE headers and section alignments.

  • Use Import REConstructor to rebuild the Import Address Table (IAT).

Common Challenges and Solutions

1. The Call Stack Appears Obfuscated

  • Some packers manipulate the call stack to hide return addresses.

  • Use hardware breakpoints on RET instructions to intercept execution transitions.

  • Analyze indirect calls and stack modifications using dynamic analysis.

2. Execution Jumps to a Random Memory Address

  • Issue: The unpacker may use obfuscation techniques to execute code dynamically.

  • Solution: Trace memory allocations and find where execution is redirected.

  • Use step-over execution to observe changes in the instruction pointer.

3. The Dumped File Fails to Execute

  • Issue: The Import Address Table (IAT) is incomplete.

  • Solution: Use Scylla to reconstruct missing imports.

  • Verify section alignments and entry point settings.

Key Takeaways

  1. Call stack backtracing helps analysts identify return-oriented execution techniques used by packers.

  2. Breakpoints on RET, POPAD, and JMP ESP help locate the transition point to unpacked code.

  3. Dumping the process memory at the OEP provides a clean version of the unpacked executable.

  4. Advanced packers may obfuscate return addresses, requiring deeper analysis of execution flow.


Technique 3 – Monitoring Memory Allocated Spaces for Unpacked Code

Overview

Monitoring memory allocated spaces is a crucial technique for manually unpacking malware. Many packers allocate memory dynamically for unpacking, writing, and executing the original malicious payload. By identifying and analyzing these allocated regions, analysts can extract the unpacked code before it is executed.

This method is extremely useful if the time to analyze a sample is limited, or if there are many of them, as here, we are not going into the details of how the original sample is stored. The idea here is that the original malware usually allocates a big block of memory to store the unpacked/ decrypted embedded sample. We will cover what happens when this is not the case later.

There are multiple Windows APIs that can be used for allocating memory in user mode. Attackers generally tend to use the following ones:

• VirtualAlloc/VirtualAllocEx/VirtualAllocExNuma

• LocalAlloc/GlobalAlloc/HeapAlloc

• RtlAllocateHeap In kernel mode

There are other functions such as ZwAllocateVirtualMemory; ExAllocatePoolWithTag can be used in pretty much the same way.

Step-by-Step Implementation

1. Load the Packed Sample into a Debugger

  • Use OllyDbg or x64dbg to analyze the packed binary.

  • Disable ASLR to keep memory addresses consistent during analysis.

2. Set Breakpoints on Memory Allocation APIs

  • Navigate to the debugger’s breakpoints tab and set breakpoints on:

    • VirtualAlloc

    • HeapAlloc

    • VirtualProtect

    • WriteProcessMemory

  • These breakpoints will pause execution when the malware allocates memory for unpacking.

3. Execute the Sample and Capture Memory Allocation Events

  • Run the malware in the debugger and wait for breakpoints to trigger.

  • Check function arguments to determine:

    • The size of the allocated memory.

    • The memory protection flags (e.g., PAGE_EXECUTE_READWRITE).

    • The return address, indicating where unpacked code may be executed.

4. Locate and Extract the Unpacked Payload

  • Once memory allocation is confirmed, inspect the allocated regions in the debugger.

  • Use Process Hacker or Scylla to dump the allocated memory.

  • Analyze the dumped code to check for valid PE headers and executable instructions.

5. Rebuild the Unpacked Executable

  • If necessary, reconstruct the Import Address Table (IAT) using Import REConstructor.

  • Fix section alignments and headers using PE-bear or CFF Explorer.

  • Save the final unpacked executable for further analysis.

Common Challenges and Solutions

1. Malware Uses Anti-Debugging Techniques

  • Some packers detect debuggers and modify memory allocation behavior.

  • Use plugins like ScyllaHide in x64dbg to bypass detection.

  • Patch IsDebuggerPresent to always return false.

2. Memory Dumps Contain Corrupted Code

  • Issue: The dumped file lacks valid PE headers or sections.

  • Solution: Use PE analysis tools to reconstruct headers manually.

  • Verify memory alignment and extract only the valid regions.

3. Execution Flow is Obfuscated

  • Issue: The malware uses indirect jumps or calls.

  • Solution: Step through execution carefully to locate where unpacked code is executed.

  • Monitor the stack for suspicious return addresses.

Key Takeaways

  1. Monitoring memory allocations helps analysts capture unpacked malware before execution.

  2. Breakpoints on VirtualAlloc, HeapAlloc, and WriteProcessMemory reveal unpacking routines.

  3. Dumping allocated memory allows for static analysis of unpacked payloads.

  4. Reconstructing the PE structure is necessary to obtain a fully functional executable.


Technique 4 – In-Place Unpacking

Overview

In-place unpacking is a technique where packed malware modifies its own code within the original memory regions, rather than allocating new memory for unpacked code. This makes detection and analysis more challenging since the unpacked payload remains within the same executable section. Identifying and capturing in-place unpacked code requires careful monitoring of self-modifying instructions and memory write operations.

Understanding In-Place Unpacking

Why Use In-Place Unpacking?

  • Some malware avoids allocating new memory to remain stealthy.

  • The unpacked payload replaces the original packed code within the same memory regions.

  • Traditional memory monitoring techniques might fail since no new memory allocations occur.

Key Indicators of In-Place Unpacking

  • Execution within writable sections (.text or .code being writable is suspicious).

  • Self-modifying code, where instructions are dynamically changed.

  • The use of VirtualProtect or NtProtectVirtualMemory to alter memory permissions.

  • Unexpected jumps or overwritten function prologues.

Step-by-Step Implementation

1. Load the Packed Sample into a Debugger

  • Use OllyDbg or x64dbg to analyze the packed binary.

  • Disable ASLR to stabilize memory addresses for better analysis.

2. Identify Writable Code Sections

  • Inspect PE section headers for writable .text or .code sections.

  • Use PE-bear or CFF Explorer to verify section attributes.

3. Set Breakpoints on Memory Protection Changes

  • Place breakpoints on API functions:

    • VirtualProtect

    • NtProtectVirtualMemory

    • WriteProcessMemory

  • These breakpoints will help identify when the malware modifies its own memory.

4. Monitor Self-Modifying Code

  • Step through execution and look for instructions being modified in real-time.

  • Set breakpoints on JMP, CALL, or MOV instructions that alter executable memory.

  • Use Process Hacker or RAMMap to detect unusual modifications to the process memory.

5. Extract and Rebuild the Unpacked Code

  • Once the unpacked payload is detected, dump the memory using Scylla or LordPE.

  • Verify the integrity of the extracted code by checking for valid PE headers.

  • If necessary, reconstruct the Import Address Table (IAT) using Import REConstructor.

  • Save the extracted binary for further static and dynamic analysis.

Common Challenges and Solutions

1. Packed Code Overwrites Itself Too Quickly

  • Issue: The malware modifies instructions too fast for manual analysis.

  • Solution: Enable instruction tracing in x64dbg to log execution history.

2. Malware Uses Anti-Debugging Techniques

  • Issue: Execution halts or modifies behavior when a debugger is detected.

  • Solution: Use anti-anti-debugging plugins like ScyllaHide or patch IsDebuggerPresent.

3. The Dumped Code Does Not Execute Properly

  • Issue: Missing imports or incorrect entry point settings.

  • Solution: Reconstruct imports using Scylla and correct the OEP manually.

Key Takeaways

  1. In-place unpacking modifies packed code directly within existing memory regions.

  2. Monitoring memory protection changes (VirtualProtect, NtProtectVirtualMemory) is critical.

  3. Self-modifying code can be traced using execution logging and memory breakpoints.

  4. Dumping and reconstructing the unpacked payload requires careful PE header validation.


Technique 5 – Searching for and Transferring Control to OEP

Overview

Searching for and transferring control to the Original Entry Point (OEP) is a crucial step in manually unpacking malware. Many packers modify the OEP to hide the original executable's code. This technique involves identifying the transition point where execution shifts from the unpacking stub to the actual malware payload and redirecting execution to the OEP.

Understanding the OEP Transition

Why Locate the OEP?

  • Most packers alter the entry point to redirect execution to an unpacking routine.

  • Finding the OEP allows analysts to obtain the clean, unpacked version of the malware.

  • Ensures that analysis is performed on the real payload rather than on the packer’s stub.

Key Indicators of an OEP Transition

  • A RET or POPAD instruction restoring registers before a jump.

  • Execution jumps outside of the packer’s stub into a new memory section.

  • A transition from dynamically allocated memory back into the .text section of the executable.

Step-by-Step Implementation

1. Load the Packed Sample into a Debugger

  • Use OllyDbg or x64dbg to analyze the packed binary.

  • Disable ASLR for consistent memory addressing during analysis.

2. Identify Execution Flow Anomalies

  • Step through execution carefully and monitor jumps that lead outside the packer's routine.

  • Look for sequences like POPAD followed by JMP or CALL to new memory locations.

3. Set Breakpoints on Transition Instructions

  • Breakpoints should be placed on:

    • POPAD (restores saved registers, indicating transition to original code).

    • JMP ESP or CALL followed by a new section entry.

  • Execution returning to .text from a dynamically allocated memory region.

4. Locate the OEP and Dump the Unpacked Executable

  • Once execution reaches the OEP, dump the process memory using LordPE or Scylla.

  • Verify that the unpacked file contains valid PE headers and correct section alignments.

5. Redirect Execution to the OEP

  • Modify the PE header to restore the original entry point.

  • Rebuild the Import Address Table (IAT) using Import REConstructor.

  • Save the final unpacked executable for further static and dynamic analysis.

Common Challenges and Solutions

1. The Malware Uses Multiple Layers of Packing

  • Issue: The unpacking routine reveals another packed layer instead of the OEP.

  • Solution: Repeat the OEP search for each unpacking stage until the final executable is reached.

2. Execution Jumps to an Unexpected Location

  • Issue: Obfuscated execution flow redirects control away from the expected OEP.

  • Solution: Trace execution history and analyze stack manipulations to find legitimate transitions.

3. Dumped File Fails to Execute

  • Issue: Missing or corrupted Import Address Table (IAT).

  • Solution: Use Scylla or Import REConstructor to rebuild the IAT.

Key Takeaways

  1. Finding the OEP is crucial for obtaining a fully functional unpacked executable.

  2. Breakpoints on POPAD, JMP ESP, and CALL instructions help identify transitions.

  3. Rebuilding the Import Address Table ensures correct execution post-unpacking.

  4. Repeating the process may be necessary for multi-layer packed malware.


Technique 6 – Stack Restoration-Based Unpacking

Overview

Stack restoration-based unpacking is a technique that involves identifying and restoring the original execution flow of packed malware by monitoring and modifying stack operations. Many packers use the stack to store essential information about the original executable, such as return addresses and register states. By analyzing these stack modifications, analysts can determine the Original Entry Point (OEP) and recover the unpacked executable.

Understanding Stack Restoration in Unpacking

Why Use Stack Restoration?

  • Some packers manipulate the stack to hide the OEP and redirect execution to an unpacking stub.

  • The stack often contains remnants of the original execution flow, which can be leveraged to reconstruct the malware.

  • Monitoring stack operations helps identify function returns that lead to the real executable code.

Key Indicators of Stack-Based Execution Manipulation

  • Excessive PUSH and POP operations before a RET instruction.

  • Unusual return addresses pointing outside known module sections.

  • Execution returning to the .text section after a series of stack modifications.

Step-by-Step Implementation

1. Load the Packed Sample into a Debugger

  • Use OllyDbg or x64dbg to analyze the packed binary.

  • Disable ASLR to maintain consistent memory addressing.

2. Set Breakpoints on Stack-Related Instructions

  • Breakpoints should be placed on:

    • PUSHAD (stores all general-purpose registers on the stack).

    • POPAD (restores previously stored register values).

    • RET (transfers execution control based on stack values).

    • CALL ESP or JMP ESP (often used in obfuscated execution transfers).

3. Analyze Stack Modifications

  • Step through execution and monitor the stack window.

  • Identify return addresses that redirect execution outside the unpacking stub.

  • Look for sequences where POPAD is immediately followed by RET or JMP instructions.

4. Identify the OEP and Extract the Unpacked Code

  • Once execution reaches the OEP, dump the process memory using LordPE or Scylla.

  • Verify the integrity of the extracted binary by checking PE headers and section alignments.

5. Rebuild Execution Flow and Redirect Control to OEP

  • Modify the PE header to restore the original entry point.

  • Rebuild the Import Address Table (IAT) using Import REConstructor.

  • Save the final unpacked executable for further analysis.

Common Challenges and Solutions

1. Stack Obfuscation Techniques

  • Issue: Some malware uses excessive NOP padding or redundant stack operations.

  • Solution: Use step-over debugging to analyze meaningful stack changes.

2. Unexpected Execution Jumps

  • Issue: Execution flow jumps to a new, unexpected memory region.

  • Solution: Trace return addresses and verify where control is transferred.

3. Dumped File Does Not Run Properly

  • Issue: The IAT is incomplete or corrupted.

  • Solution: Use Scylla or Import REConstructor to rebuild missing imports.

Key Takeaways

  1. Stack restoration helps recover the original execution flow of packed malware.

  2. Breakpoints on PUSHAD, POPAD, and RET instructions aid in identifying execution transitions.

  3. Monitoring stack operations reveals crucial return addresses that lead to the OEP.

  4. Dumping and reconstructing the binary is necessary for further analysis.


Dumping the unpacked sample and fixing the import table

Overview

After successfully unpacking a malware sample, the next critical step involves dumping the unpacked code from memory to disk and fixing its import table. This process is essential to ensure the malware sample can be analyzed as an independent executable, allowing for further static and dynamic examination.


Dumping the Unpacked Sample

Why Dump the Unpacked Sample?

  • The original malware is packed, making it difficult to analyze directly.

  • Dumping the sample allows analysts to obtain a fully functional executable for further investigation.

  • Ensures that unpacked malware can be tested in a controlled environment.

Tools Used for Dumping the Unpacked Sample

  1. OllyDump (OllyDbg Plugin)

    • Dumps the process memory back into an executable file.

    • Can set the OEP as the new entry point.

    • Has an option to fix the import table, though this can be skipped if using another tool.

  2. PETools, LordPE, and VSD

    • Used for dumping original sections or specific memory regions where the unpacked code resides.

    • PETools and LordPE are designed for 32-bit Windows analysis.

    • VSD supports both 32-bit and 64-bit environments.

Step-by-Step Process to Dump the Sample

  1. Load the Unpacked Process into a Debugger

    • Open the malware in OllyDbg or x64dbg and execute until the unpacked code is reached.

  2. Identify the OEP (Original Entry Point) " After unpack the binary using one of the previous techniqes "

    • Track execution to find where the original unpacked code begins.

    • Set breakpoints on key transition instructions (POPAD, CALL ESP, RET).

  3. Dump the Memory Using OllyDump or LordPE

    • Extract the active memory region containing the unpacked executable.

    • Ensure the dump contains a valid PE header and necessary sections.


Fixing the Import Table

Why Fix the Import Table?

  • When a PE file is loaded into memory, the Windows loader resolves import addresses dynamically.

  • The original import table only contains API names or ordinal values, not the resolved addresses.

  • Fixing the import table ensures the dumped executable runs correctly outside of memory.

Step-by-Step Process to Rebuild the Import Table

  1. Load the Dumped File into an Import Table Reconstructor

    • Use Import REConstructor (ImpREC) for 32-bit executables.

    • Use Scylla or CHimpREC for 64-bit Windows.

  2. Set the Correct OEP

    • Manually enter the correct OEP in ImpREC.

    • Use the AutoSearch function to locate the missing imports.

  3. Validate and Rebuild the Imports

    • Remove invalid or duplicate import entries.

    • Fix invalid API addresses by replacing them with original function names or ordinals.

  4. Save the Fixed Executable

    • Apply the import table fixes and save the corrected file.

    • Verify the repaired executable using PE-bear or CFF Explorer.


Additional Considerations and Challenges

1. API Addresses Need to Be Restored

  • The memory dump might contain resolved API addresses, which need to be reverted to original references.

  • This is done by replacing the resolved addresses with function names or ordinal values in the IAT.

2. Memory Dump May Not Contain a Clean PE Structure

  • The unpacked code may not align perfectly with original section mappings.

  • Manual adjustments using PE header editors may be necessary.

3. Some Malware Injects the Unpacked Code Elsewhere

  • In some cases, the original loader injects the unpacked code into another process before execution.

  • Analysts may need to monitor injected processes and extract the executable from there.

4. Dependency on the Original Packer

  • Some unpacked code may still require the original packer’s runtime environment to execute properly.

  • Additional debugging and patching may be needed to make the file independent.

Key Takeaways

  1. Dumping the unpacked sample ensures analysts can work with a standalone executable.

  2. Tools like OllyDump, LordPE, and PETools allow analysts to extract memory regions.

  3. Fixing the Import Table is necessary to restore API references and ensure execution.

  4. Additional PE adjustments may be required to reconstruct a fully functional sample.


Be Wait For The Next Part Of The Chapter

And Don't Forget To

💓
Follow Me !!
Packed File Sections Form
The PEiD tool detecting UPX
The PEiD tool’s section viewer
The import table of an unpacked sample versus a packed sample with UPX
The UPX magic value and section names have changed but the sample remains fully functional
The QuickUnpack tool in detail
UnPacMe Website, One OF Best Generic Unpackers
Changing memory permissions in OllyDbg Before Setting Breakpoints
Staying at the OEP of the sample in OllyDbg
Stack Form ; Stored values followed by a return address in OllyDbg
Call Stack Table Which Will Be Used In Setting Our Breakpoints
First Return Value
Last Return Value
Following the last return address in OllyDbg
Setting a breakpoint at memory allocation in WinAPI
Uncommon control transfer involving a register
The OllyDump UI
The Region Dump window of PETools
The ImpREC interface
The import table before and after PE loading
Page cover image